Way back in 2011, I collected 13 adult male dragon lizards. At the time they were considered tawny dragons (Ctenophorus decresii). Since then, the tawny dragon has been the subject of intense study, including genetic study of its populations. As a result, we know now that the tawny dragon isn’t a species after all, but three species. Today, what I collected is known as the swift dragon (Ctenophorus modestus), and unfortunately the two papers I published describing the brain anatomy of those thirteen lizards both refer to them as the wrong species.

A swift dragon (Ctenophorus modesta), photographed by Tobias Hayashi during fieldwork to collect dragons for my PhD in 2011. At the time, this was considered a tawny dragon (Ctenophorus decresii).
Two papers. The same 13 individuals. How, and why, would someone go through all the trouble of publishing two papers on the same thing? Other than the obvious publish-or-perish, academia-as-an-infinite-hamster-wheel-of-papers reason? Please let me to explain.
Early in my PhD I was trying to figure out how to study lizard brains. Luckily, I happened to meet Jeremy Ullmann, who had done his PhD on fish brains and was doing a postdoc segmenting a mouse brain MRI model (more on that in a second). Amongst many other crucial contributions he made to my PhD, Jeremy introduced me to the idea of using MRI to study lizard brains, as he had done with fish and mice. The primary advantage was that you can study the anatomy of the entire brain at once instead of being limited to specific structures of interest, as is the case for more traditional neuroanatomical methods.

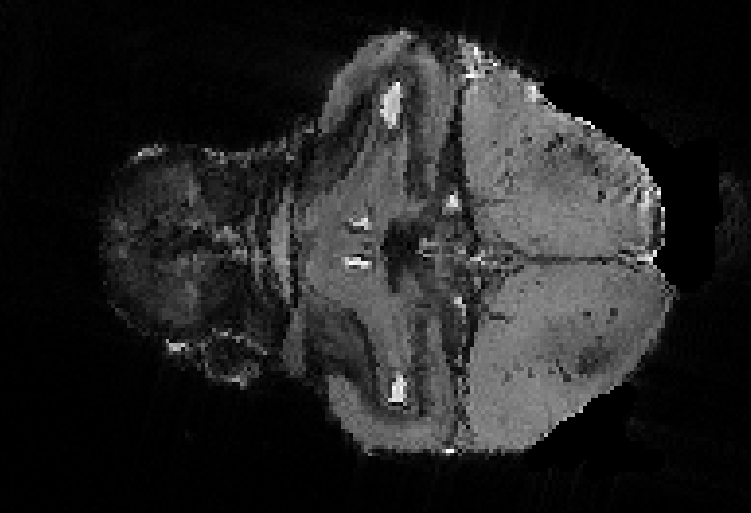
A slice through an MRI, fresh out of the scanner, with no post-processing. This is a lateral view of a lizard head facing right. The brain is clearly visible, can you see it?

Here’s the head of a swift dragon - possibly even the same individual - in the same orientation as the MRI above.
A model, in the sense I’m using here, is outwardly similar to an MRI in that it’s a 3D, greyscale image. However, instead of being an image generated by measuring the effect of changing magnetic fields on the spin of hydrogen atoms, a model is a meta-that. It’s an “average” of many MRI images that are all more-or-less of the same thing, in this case brains all from the same species, and sex, of lizard. Because the model is an amalgamation of multiple images, it is able to drastically increase the signal, and reduce the noise, in the original images. This results in a much clearer picture of the brain. The model Andrew built is now the basis for two papers describing lizard brain anatomy. This is Jeremy’s fault.

Jeremy, as I said, was working on segmenting a mouse brain model at the time. Let’s talk about segmentation. An MRI image - or model - is made up of voxels. Voxels are 3D pixels, and segmentation is the process of assigning each voxel an identity. In Jeremy’s case (and in my case), the identity is the anatomical region that voxel is part of (cortex, thalamus, basal ganglia, etc). Jeremy’s full time job, what he had been working on for years, was segmenting certain parts of the mouse brain. Not even the whole thing, just bits of it. A brain image or model segmented into its anatomical regions is called a segmentation atlas. Pictures of brains with the anatomical regions labelled in any fashion is called a brain atlas.
My aspiration, which I explained to Jeremy, was to segment the whole lizard brain model. When I started my PhD, there hadn’t been a reptile brain atlas published since the early 1990s. The ones that were available, though very useful, were woefully inadequate compared to the modern atlases published for other vertebrate groups. This only added to the difficultly of what I was proposing and Jeremy, wisely, advised against this plan. A full segmentation atlas was an insurmountable amount of work for a PhD student. At best, I would graduate with a thesis that was entirely just the atlas, if I were able to finish it on time.
So instead I did half the work: I figured out what brain regions were visible on my Ctenophorus decresii/modesta brain model and, instead of the long process of digitally “painting” the brain regions onto the model, I took select images of the model and labelled them. This is the format of a normal brain atlas, including the ones most in use today. The brain is sliced (digitally in my case) and pictures are taken of each slice. The brain regions visible in each picture are labelled. A version of this atlas was included in my thesis (as one of five chapters, not the whole thing) and the final version was published here.
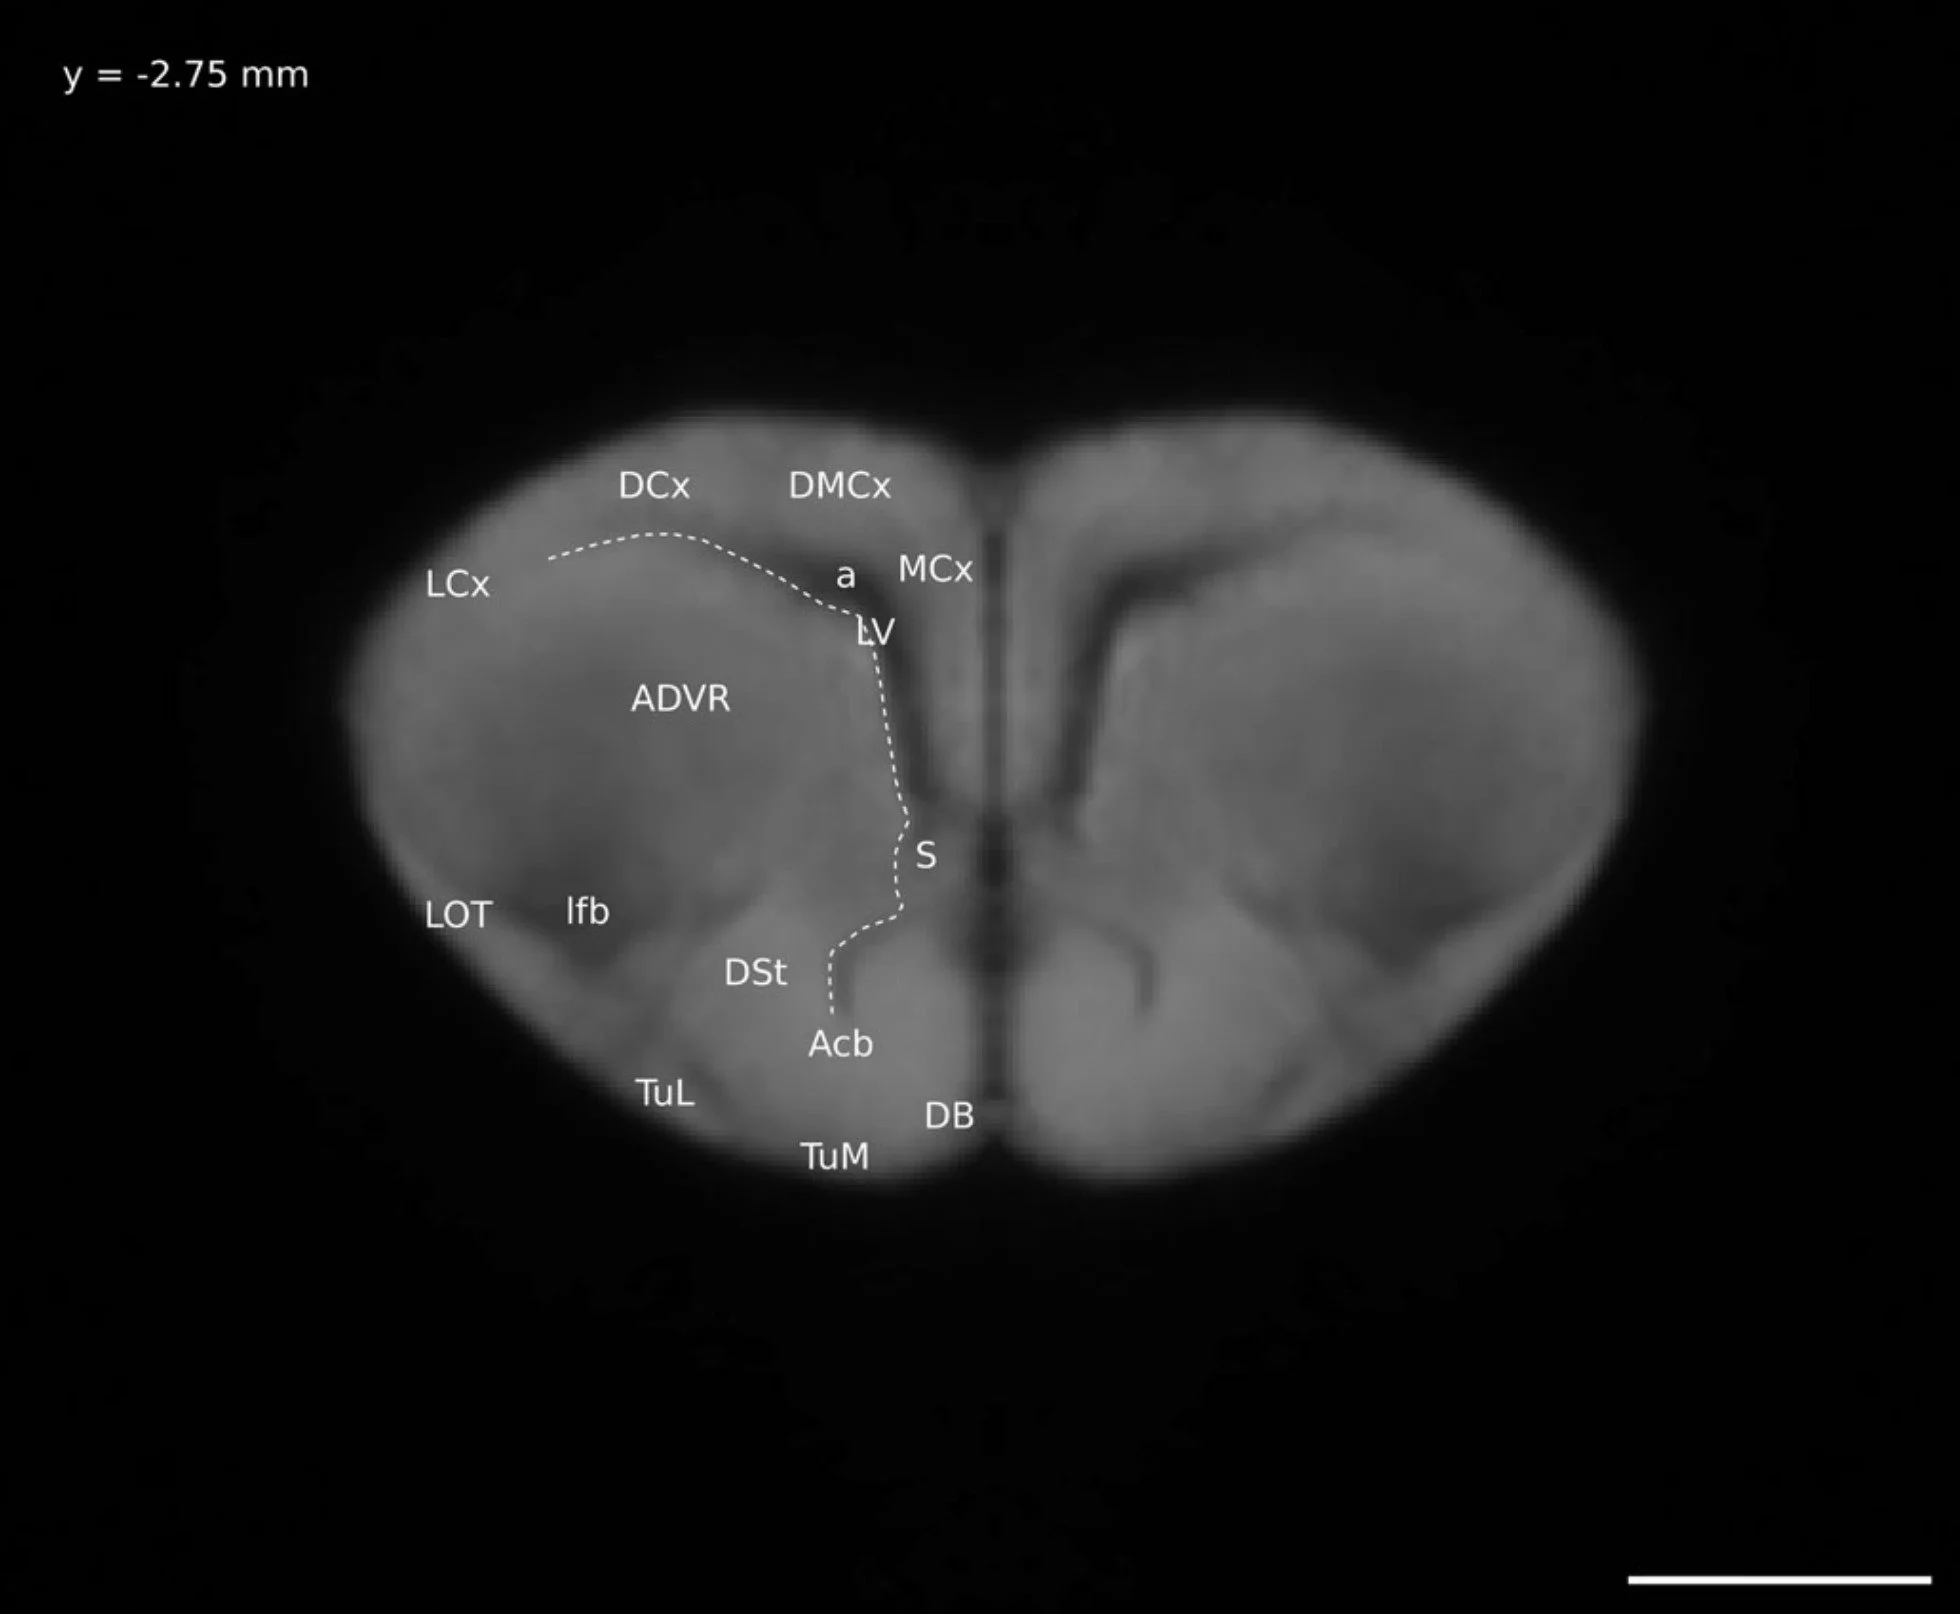
A digital “slice” through my lizard brain model, with the distinguishable anatomical regions labelled. This is Figure 6 in this paper.
This atlas is enough for most people, as Jeremy astutely advised me it would be. Most people who would need to know brain anatomy don’t work with brains in 3D, they work in 2D. The vast majority of neuroscience is done with brain slices, often looking down a microscope at them, or, an improbably high amount of the time, just holding the brain slice really close to one’s face and squinting at it. To identify brain regions on these slices, what you need is not a 3D image that has been segmented into brain regions, but a series of 2D images you can flip through until you find the image that most closely resembles the slice of the brain you are interested in. So most of the time, someone interested in lizard brain anatomy will find my 2018 brain atlas most useful.

A histological section through a lizard brain (left) and the corresponding figure from my brain atlas (right). This is figure 41 from this paper.
The segmentation atlas came into being out of necessity; my own personal necessity. The information in the segmentation atlas is essentially identical to that in my traditional brain atlas because the 2018 atlas was used as the primary source for anatomical information for the segmentation atlas. What’s different, then, is who - or what - the information is geared to. The traditional-style atlas is designed to be easily understood by humans. The segmentation atlas is designed to be easily understood by computers.


The purpose of the segmentation atlas is to measure 3D lizard brain images. I myself have over 400 lizard brain MRIs, some collected during my PhD and others during my time as a postdoc at SickKids Hospital in Toronto. I have exactly zero desire to measure these brain images by hand, and it would be physically impossible for me to measure all the brain regions in the segmentation atlas by hand. That is the purpose of the segmentation atlas, the reason for its existence. It can measure all the brain regions, over the entire lizard brain, in all of my MRI images, and it can do it with better precision than a human.*
It can also do this for your 3D lizard brain images, if you have any. Be they MRI, CT, confocal, lightsheet, endocast, etc, you’re far better off using the segmentation atlas to get whatever measurements you want out of your images than you are trying to do them by hand. Save yourself time, frustration, heartache, and repetitive strain injuries. Let the computer take the measurements for you, the segmentation atlas is published here.
So that’s why I published two different papers using the same lizard brain model. To make it easier for people who want to study lizard brains, including myself, whether they use traditional 2D histological techniques, or more newfangled 3D imaging. These two atlases will hopefully make lizard brain research much less daunting than it was when I started by collecting those tawny dragons - or swift dragons, or whatever - ten years ago.
* Not better accuracy, though. I’m still responsible for quality control.